Frédéric GonthierProfessor of Political Science at Sciences Po Grenoble and at the Pacte laboratory, @FredGonthier
It is now well established that the health crisis linked to the Covid19 pandemic led to an exceptional worsening of social inequalities. In France, while social policies and government measures have partly compensated for the loss of household income, inequalities have nonetheless widened due to the wide social disparity of aggravating factors. On the one hand, since the risk of exposure to the virus varies according to social background, older people, those born abroad and those living in the poorest communes were more affected than others. In addition, the fall in economic activity led to an increase in short-time working, which affected blue-collar and white-collar workers more than executives, and contributed to a deterioration in the financial situation of households whose incomes were already the most modest. Finally, the historic enrichment of large fortunes during the pandemic led to an increased concentration of wealth.
All all these factors, the question of wealth distribution has re-emerged public debate. Admittedly, the theme of inequality has struggled to find its way into the the presidential campaign, overshadowed at the outset by health concerns health concerns and a focus on immigration and security, then overshadowed by the war in Ukraine. Nevertheless, the repeated interventions on the theme of purchasing power and issues such as inheritance tax such as inheritance tax, capital taxation and student income, show that inequality was a major sub-text of the presidential campaign. campaign.
We are therefore justified in asking how the French assess the way in which wealth is distributed today, how it should be, and whether their judgments are influenced by their social and political positioning. The latest edition of theISSP survey on social inequality provides some answers.
A social structure deemed too unequal
It's common practice in opinion surveys to ask people whether they want more or less social justice, or whether they agree more or less with the idea that inequalities are too great. The responses generally paint a picture of a broad consensus on a just society and a strong rejection of inequalities. As instructive as this image is, it leaves in the shade the more global question of social stratification, i.e. the hierarchical positioning of individuals in the social structure and the wealth inequalities that result.
To gain a better understanding of judgments on social stratification, since 1999 the ISSP has been asking respondents to choose from a range of stylized shapes those they feel best represent current and ideal societies. Five options are proposed, ranging from a highly unequal social structure (type A) to a much more balanced distribution of wealth (type E), via a gradation of intermediate forms (types B, C and D) (figure 1). The question is twofold: " First, which type does France correspond to, and which drawing best represents it? And, in your opinion, what should France look like, what would you prefer? "

Figure 1: Types of society shown in the ISSP Inequality survey, from the most unequal (type A) to least unequal (type E)
In the latest survey, carried out in 2021, around half of those questioned (46%) consider French society to be most like a pyramid "with a small elite at the top, many people in the middle and even more at the bottom" (type B) (figure 2). The other half is divided between a slightly more egalitarian and a slightly more unequal vision, with types C and A garnering 18% and 17% of responses respectively. Type D, whose spinning top representation is often used to illustrate the idea of moyennisation, was chosen by only 13% of French people. Type E received only 2% of responses.
In contrast, half of all French people mention the top structure as a characteristic of their ideal society, which no doubt reflects the symbolic appeal of a "middle-class" society. The most egalitarian society (type E) attracts 20% of respondents; a modest percentage that perhaps expresses less the absence of aspirations for a less unequal society than a logic of adjusting these aspirations to the objective possibilities of profoundly changing the social structure.
Contrary to what might have been expected given the strong social disparities in terms of inequality, judgments on stratification are not very sociologically divided. Women, the 18-25 age group and the economically inactive are slightly more likely to mention type A. Type B is slightly over-represented among the over-55s, the least educated, the active unemployed and the retired. Differences are smaller for types C, D and E. Subjective position in the social hierarchy - measured in the ISSP by respondents' placement on a scale ranging from 1 (for the bottom of society) to 10 (for the top)- is slightly more influential than objective factors: those citing types A and B are on average lower on the social scale (4.1 and 4.8 respectively) than those citing type C (5.3).
The sociological variations are even more limited to the desired society. The under 45, the unemployed and the less economically advantaged tend to prefer a more egalitarian structure (type C and D).
At first glance, political logics are just as indiscriminate as social logics. As can be seen in Figure 2, it is above all the top-down society that is more readily used by people in the center and on the right to describe French society. As for the ideal society, with the exception of type B, which is significantly more frequently cited on the right, and type E, which is significantly less frequently cited in the center, judgments vary little according to political orientation. This is particularly true of type D, which is preferred by French men and women. A kind of consensus therefore seems to be emerging on what French society looks like, and what it should look like.
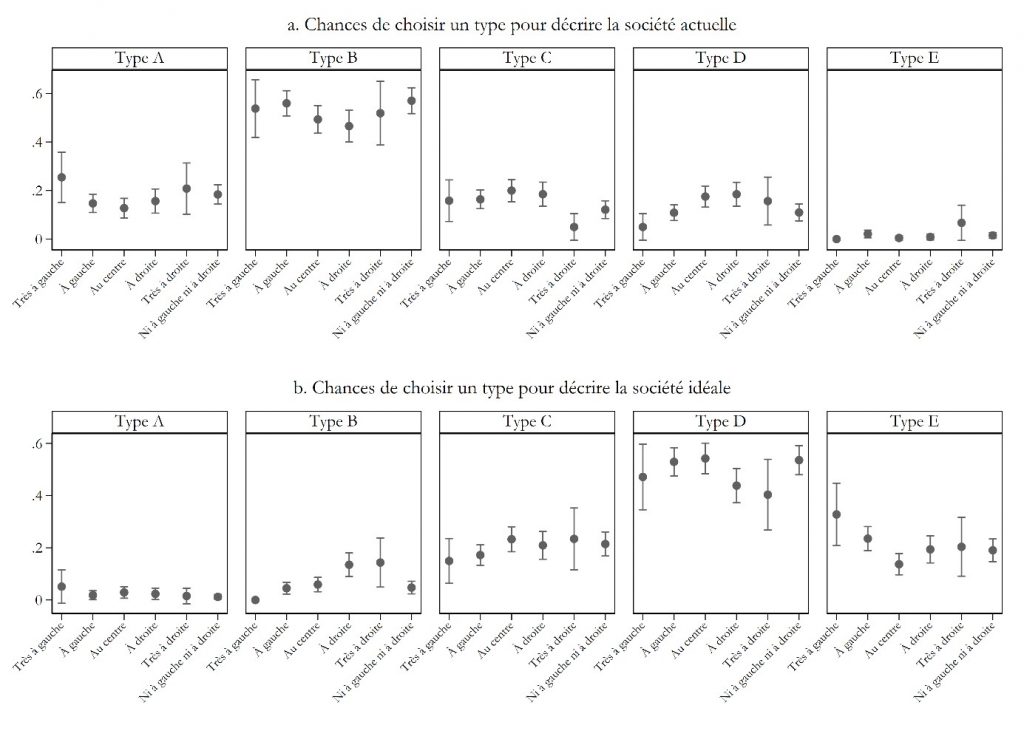
Figure 2: Chances of choosing a type of company as a function of political positioning. The coefficients (odds ratios) are derived from different logistic regression models controlling for the effects of gender, age, level of education, employment, household income, subjective positioning in the social hierarchy and interest in politics. They read as follows: out of a 100% chance of choosing an ideal type of society, people who don't fit into the left-right scale have a 54% chance of choosing type D, 21% type C, 19% type E, 5% type B and 1% type A (source: ISSP Social Inequalities V - France).
Judgments more divided politically than sociologically
In fact, the political logics at work here are based less on individuals' judgments of the state of society than on their relationship to social change. We know that the most closed-minded people, with their psychological predisposition towards security and aversion to uncertainty, prefer traditional values that guarantee authority, order and social stability. Conversely, more open-minded people, who see change as an opportunity rather than a psychological threat, will turn to less conventional values. We also know that these psychological traits and value orientations translate into distinct political stances. Preference for the status quo is more marked on the right and extreme right, while support for social transformation is more pronounced on the left and extreme left.
To this, we calculated a score corresponding to the gap between the current and ideal and the ideal type of company. The more positive the score, the more egalitarian egalitarian, relative to the current structure ; and vice versa. The amplitude of the score indicates the size of the gap. It is For example, it's 1 if the current type is A and the ideal type is B. It's 2 if the current type is B and the ideal type is B. the current type is B and the ideal type is D. -3 if the actual type is D and the ideal type is A.... A score of zero therefore means that the ideal society is the same as the current one. Unsurprisingly, negative scores are few and far between: only 7% of respondents aspire to a more unequal society. Zero scores represent 16% of responses. Positive scores are in the majority, with respectively 27, 29, 18 and 3% for scores 1, 2, 3 and 4.
Figure 3 highlights the effect of political orientation on this score, other factors being held constant. Compared to right-wingers, left-wingers are significantly more likely to choose an ideal society that is more egalitarian than the current one, by 0.4 points for left-wingers and 0.8 points for very left-wingers. People who do not identify with the left-right opposition also have a higher probability of wanting a less unequal society. These results confirm just how deeply political orientation can divide people's propensity for social change.
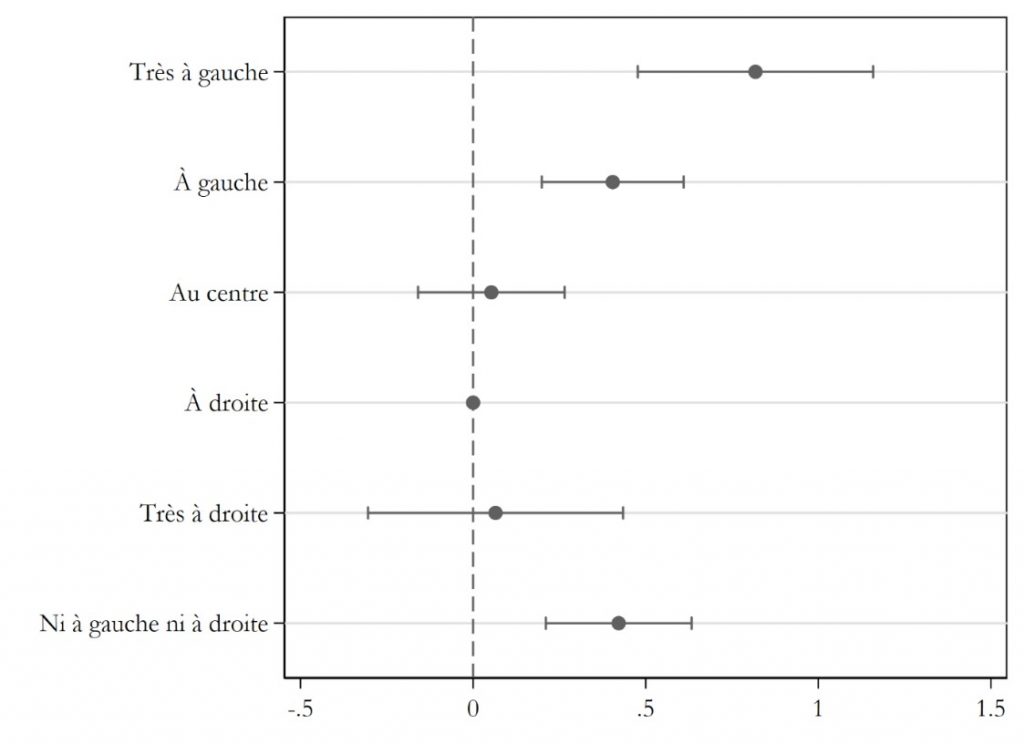
Figure 3: Probability of choosing a more egalitarian society as a function of political positioning. The coefficients are derived from a linear regression model controlling for the effects of gender, age, level of education, employment, household income, subjective positioning in the social hierarchy and interest in politics. They read as follows: identifying oneself as very left-wing increases the probability of choosing a more egalitarian society by almost one point (source: ISSP Inégalités sociales V).
The Tocquevillian expression "passion for equality" is often used to explain the strong sense of social injustice in France. The results presented here qualify this overly culturalist explanation. Beyond the apparent consensus on the shape of the current society and that of the ideal society, the aspiration to transform society and make it less unequal is far from shared, and remains structured by left-right opposition.
This post is based on a more detailed summary available in Progedo's Hypothesis notebook.